Public Wants to Know Hurricanes' Intensification Potential, Embry-Riddle Study Shows
 Michaela Jarvis
Michaela Jarvis
/
Michaela Jarvis
Oct 22, 2025, 8:53 AM
In August 2020, a storm known as Tropical Depression #13 began moving from south of Florida into the Gulf of Mexico. The information available to National Hurricane Center forecasters presented great uncertainty regarding whether it would intensify and, if so, by how much.
The storm could completely dissipate, or it could intensify into a major hurricane. The information publicly disseminated at that time offered a conservative prediction of the storm’s forecast intensity.
As it turned out, the tropical depression intensified into Hurricane Laura, a Category 4 storm that killed 81 people and caused $23.3 billion in damage.
“The worst-case scenario turned out to be the correct prediction,” said Dr. Rob Eicher, associate professor of Meteorology, who co-led a recent study on tropical weather predictions with Dr. Daniel Halperin, associate professor and program coordinator for the Bachelor of Science in Meteorology. “Dan and I started talking and basically came to the same conclusion — there has to be a better way to express that type of uncertainty.”
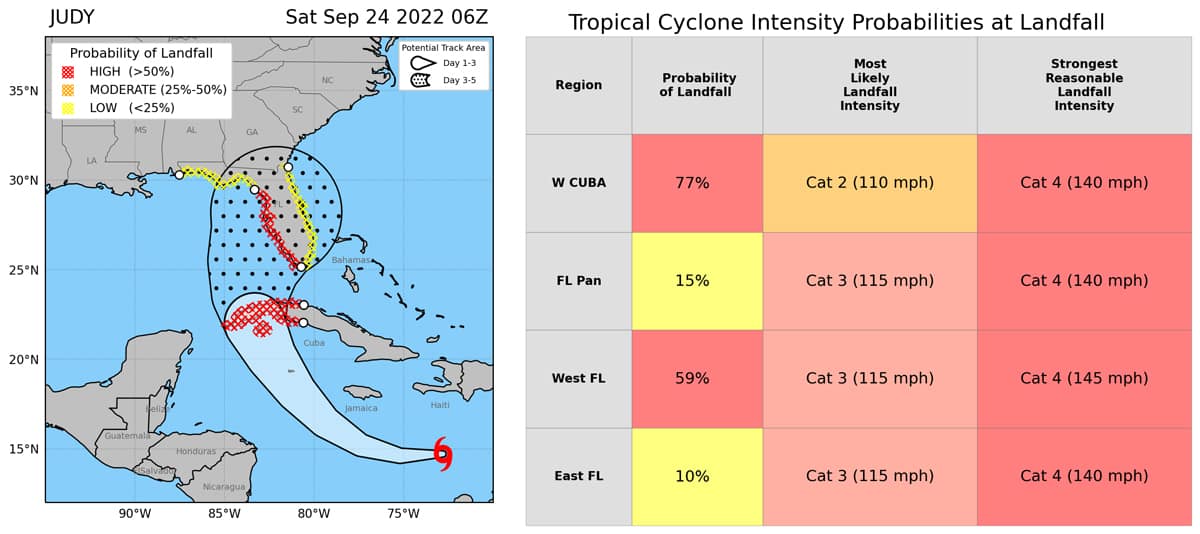
This graphic, one of the best-performing in the study, combines the cone of uncertainty and a short chart with the chance of landfall at a few different locations expressed as percentages, as well as each one’s range of possible intensities.
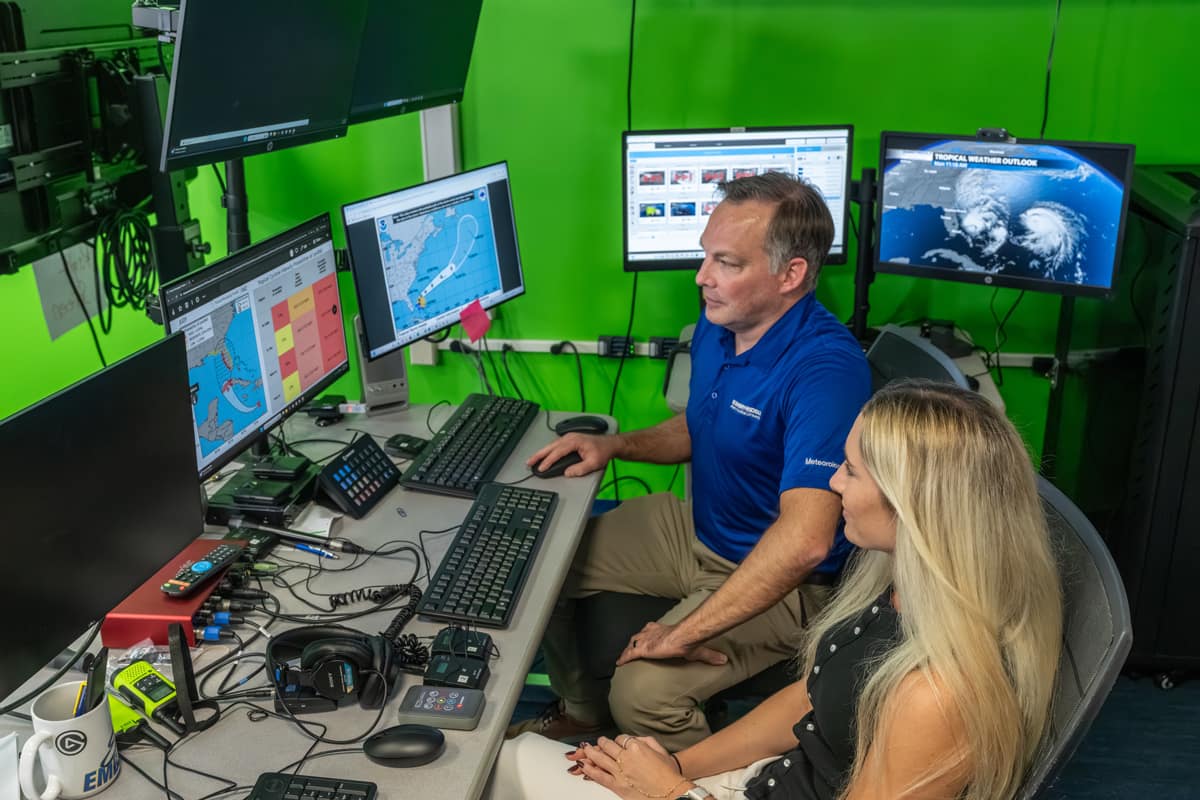
The Embry-Riddle Aeronautical University researchers went on to poll more than a thousand Florida residents — plus National Weather Service forecasters, broadcast meteorologists and emergency managers — about their understanding of the commonly recognized hurricane “cone of uncertainty” graphic, which does not in itself convey the degree of uncertainty around whether a storm will intensify.
The respondents were also polled on modified forecast graphics that added numerical information characterizing the chance of storm intensification.
The best-performing graphics included a short chart — with or without the cone of uncertainty — displaying the chance of landfall at a few different locations expressed as percentages, along with the “most likely landfall intensity” and the “strongest reasonable landfall intensity” expressed as wind speeds and corresponding hurricane categories. Nearly 90 percent of those surveyed said they preferred some percentage values indicating probability in weather forecasts, versus forecasts with words and symbols only.
The resultant research, published in the journal Meteorological Applications, found that expressing the estimated chance of a tropical storm or hurricane intensifying as a numerical probability helps the public better understand hurricane forecasts.
“Better communication of forecast uncertainty helps residents, emergency managers and policymakers make smarter, safer decisions,” said Eicher.
The cone of uncertainty has received criticism for being misunderstood when hurricanes threaten. Although the cone depicts the potential path in which the center of a storm is expected to pass, studies show that people often interpret the cone as the entire area that is threatened, and those who live outside of the cone erroneously consider themselves out of harm’s way.
Those issues, though not the focus of the researchers, did surface during their interviews with emergency managers and meteorologists, Eicher said.
“Some of our experts thought it was a good idea to highlight the fact that damaging winds could occur outside of the cone, while others thought it might lead to confusion,” he said.
Partly for this reason, the researchers’ revised graphics included versions with and without the cone.
“In our second round of surveys, the combination of a long table of probabilities with the cone scored lowest in perceived message effectiveness,” he said, “implying that version of the prototype may in fact be confusing to some.”
Eicher said that as rapid intensification of tropical cyclones becomes more common, a trend that has grown because of sea surface warming in recent years, “it is probably more important than ever to predict intensity in terms of probability. Rapid intensification is difficult to predict, so there is an increased risk of poorly anticipated, high-impact events. If we don’t want people to be caught off guard, we should tell them what the possibilities are.”
Student researcher Madison Croker, who in May earned a bachelor’s degree in Meteorology with a minor in Communication, said participating in the research deepened her understanding of communicating with the public.
“I realized how important it is not just to build probabilistic forecast models, but to listen to what people actually say about them. My role — sorting feedback across multiple research groups and distilling common themes about what people liked or disliked — gave me a sharper sense of how to communicate tropical cyclone risks in ways that matter,” Croker said. “It’s made me even more committed to making sure communities understand both the uncertainties and the impacts when severe weather threatens.”
More research is needed to further develop the best forecast graphics to communicate to the public, Eicher said. In the meantime, he said, “It seems clear that people want to know their risk in quantified terms, and we should give them that information.”